
Page 88 - 《含能材料》火工品技术合集 2015~2019
P. 88
Performance of Integrated Exploding Foil Energy Conversion Unit Based on FPC 793
that characteristic of energy conversion unit based
3 Results and Discussion on FPC fabrication process has similar law as that
based on traditional machining process reported in
3.1 Electrical Explosion Performance
Figure 3 represented the voltage and current literature[15]. Material type of tamper and barrel
change of bridge foil in the discharge circuit unit hardly influenced mechanism and characteristics of
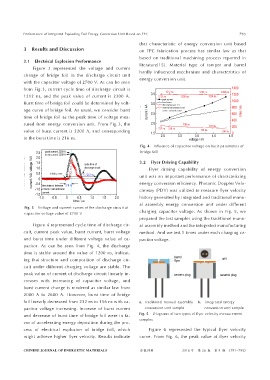
with the capacitor voltage of 2700 V. As can be seen energy conversion unit.
from Fig.3, current cycle time of discharge circuit is
1212 ns, and the peak value of current is 2300 A.
Burst time of bridge foil could be determined by volt‑
age curve of bridge foil. As usual, we consider burst
time of bridge foil as the peak time of voltage mea‑
sured from energy conversion unit. From Fig. 3, the
value of burst current is 2200 A, and corresponding
to the burst time is 216 ns.
Fig. 4 Influence of capacitor voltage on burst parameters of
bridge foil
3.2 Flyer Driving Capability
Flyer driving capability of energy conversion
unit was an important performance of characterizing
energy conversion efficiency. Photonic Doppler Velo‑
cimetry (PDV) was utilized to measure flyer velocity
history generated by integrated and traditional manu‑
al assembly energy conversion unit under different
Fig. 3 Voltage and current curves of the discharge circuit at
capacitor voltage value of 2700 V charging capacitor voltage. As shown in Fig. 5, we
prepared the test samples using the traditional manu‑
Figure 4 represented cycle time of discharge cir‑ al assembly method and the integrated manufacturing
cuit, current peak value, burst current, burst voltage method. And we test 5 times under each charging ca‑
and burst time under different voltage value of ca‑ pacitor voltage.
pacitor. As can be seen from Fig. 4, the discharge
time is stable around the value of 1200 ns, indicat‑
ing that structure and composition of discharge cir‑
cuit under different charging voltage are stable. The
peak value of current of discharge circuit linearly in‑
creases with increasing of capacitor voltage, and
burst current change is rendered as similar law from
2080 A to 2680 A. However, burst time of bridge
foil linearly decreased from 232 ns to 156 ns with ca‑ a.traditional manual assembly b. integrated energy
pacitor voltage increasing. Increase of burst current conversion unit sample conversion unit sample
and decrease of burst time of bridge foil were in fa‑ Fig. 5 Diagrams of two types of flyer velocity measurement
samples
vor of accelerating energy deposition during the pro‑
cess of electrical explosion of bridge foil, which Figure 6 represented the typical flyer velocity
might achieve higher flyer velocity. Results indicate curve. From Fig. 6, the peak value of flyer velocity
含能材料 2018 年 第 26 卷 第 9 期 (791-795)
CHINESE JOURNAL OF ENERGETIC MATERIALS