
Page 22 - 《含能材料》2018年优秀论文
P. 22
688 FENG Song,RAO Guo‑ning,PENG Jin‑hua
onation velocity D = 8862 m·s ,heat of detonation
-1
Q = 5.23 kJ·g )booster charges of 0.7 g and elec‑
-1
v
tric detonator(detonator No. 26)were used for firing.
#
Figure 2 shows the explosive charges of sample 4 .
a. sample 2 #
Fig. 1 Schematic diagram of the experimental setup
b. sample 4 #
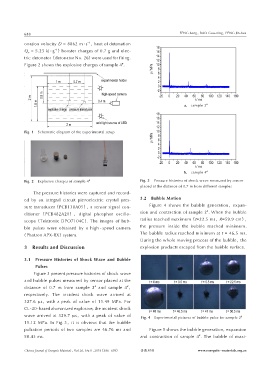
Fig. 2 Explosive charges of sample 4 # Fig. 3 Pressure histories of shock wave measured by sensor
placed at the distance of 0.7 m from different samples
The pressure histories were captured and record‑
ed by an integral circuit piezoelectric crystal pres‑ 3.2 Bubble Motion
sure transducer(PCB138A05),a sensor signal con‑ Figure 4 shows the bubble generation,expan‑
#
ditioner (PCB482A20), digital phosphor oscillo‑ sion and contraction of sample 2 . When the bubble
scope(Tektronix DPO7104C). The images of bub‑ radius reached maximum(t=22.5 ms,R=59.9 cm),
ble pulses were obtained by a high ‑ speed camera the pressure inside the bubble reached minimum.
(Photron APX‑RX)system. The bubble radius reached minimum at t = 46.5 ms.
During the whole moving process of the bubble,the
3 Results and Discussion explosion products escaped from the bubble surface.
3.1 Pressure Histories of Shock Wave and Bubble
Pulses
Figure 3 present pressure histories of shock wave
and bubble pulses measured by sensor placed at the
#
#
distance of 0.7 m from sample 2 and sample 4 ,
respectively. The incident shock wave arrived at
327.6 μs,with a peak of value of 15.49 MPa. For
CL‑20‑based aluminized explosive,the incident shock
wave arrived at 329.7 μs,with a peak of value of Fig. 4 Experimental pictures of bubble pulse for sample 2 #
15.12 MPa. In Fig. 3,it is obvious that the bubble
pulsation periods of two samples are 46.76 ms and Figure 5 shows the bubble generation,expansion
#
50.43 ms. and contraction of sample 4 . The bubble of maxi‑
Chinese Journal of Energetic Materials,Vol.26, No.8 , 2018(686-695) 含能材料 www.energetic-materials.org.cn